Skip to content

Axis limits are set badly with small values in scatter(). #9979

@naught101

Description

@naught101

I'm not sure if this is related to #7413

Bug report

Example:

%pylab
x = randn(1000) / 1e5
y = randn(1000) / 1e5
scatter(x, y)

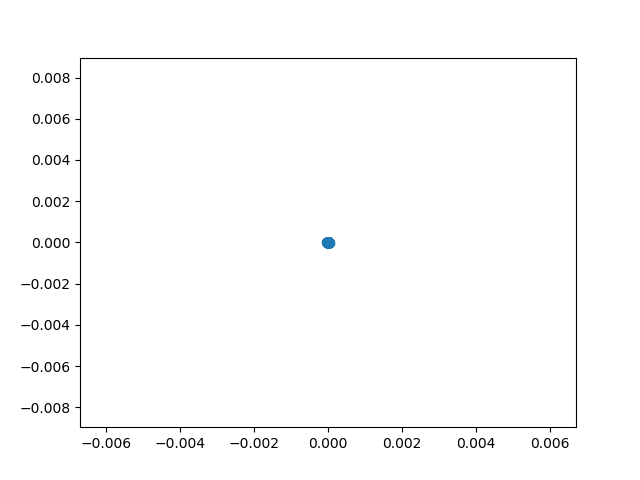
produces this:
figure_1

It should really produce something more like this:
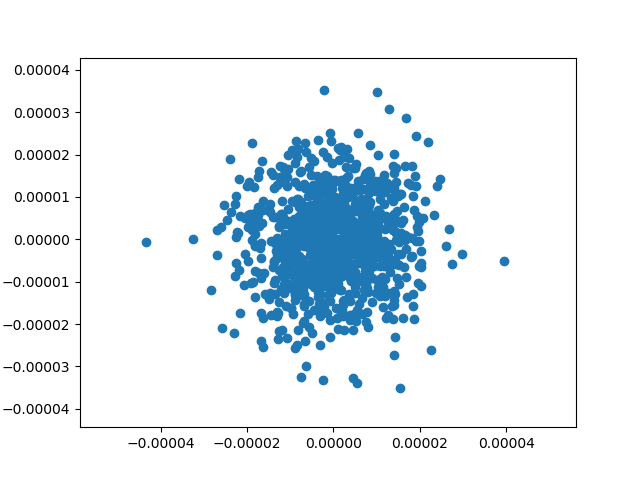
figure_1-2

There's not an obvious way to do this, other than manually getting the min/max x and y values and adding a little bit and using ax.set_x/ylim()

Using conda on kubuntu:

matplotlib                2.1.0            py36hba5de38_0  
python                    3.6.3                h0ef2715_3  

Metadata

Metadata

Assignees

No one assigned

    Labels

    No labels
    No labels

    Type

    No type

    Projects

    No projects

    Milestone

    Relationships

    None yet

    Development

    No branches or pull requests

    Issue actions

      pFad - Phonifier reborn

      Pfad - The Proxy pFad of © 2024 Garber Painting. All rights reserved.

      Note: This service is not intended for secure transactions such as banking, social media, email, or purchasing. Use at your own risk. We assume no liability whatsoever for broken pages.


      Alternative Proxies:

      Alternative Proxy

      pFad Proxy

      pFad v3 Proxy

      pFad v4 Proxy