MLSO data taken on this day are preliminary. The MLSO team is working on the final calibration and new data will be released when this work is completed.
MLSO is currently closed due to the eruption of Mauna Loa. Please check the MLSO home page for updates.
NOTE: There may be a delay after clicking buttons below while image loads.

 Download
ZIP file containing all above quicklook images and movies
Download
ZIP file containing all above quicklook images and moviesMore information about this zip file (description of contents and filelist)
For more information about UCoMP wavelengths, see the spectral line table below
UCoMP Data Use and Acknowledgements
If using UCoMP data in a publication:
Data Information and Availability
Level 1 FITS: The Level 1 tar file contains coronal emission line images calibrated to remove instrumental effects. Each Level 1 fits file consists of extension arrays containing the Stokes parameters I, Q, U, and V at a sequence of wavelengths that span the coronal emission line and the corresponding continuum intensities. The number of points observed across the line is designated in the filename, e.g. ‘.p3’, or ‘.p5’, or .’p7’, where p3 indicates 3 points taken across the emission line, p5 indicates 5 points, etc.. Fits filenames ‘ending in ‘.intensity.fts’ contain only Stokes I at each wavelength across the emission line. The tar file also contains a mean and median file of Stokes I, Q, U and V for each emission line.
Level 2 FITS: The Level 2 tar files contain a variety of science products for coronal emission lines observed this day. Every Level 2 fits file contains 6 Stokes I derived science products and FeXIII observations also contain Stokes Q & U derived products (see table below).
The tar file also contains a daily mean and median file of each of these data products.
Average and Median FITS: This tar file contains all Level 1 and Level 2 average and median fits data products. Level 1 files contain the average and median Stokes I, Q, U, V across each coronal emission line. The Level 2 files contain the average and median of each of science products noted in the table above (see Level 2 FITS).
Quicklooks: The quicklook zip file contains all of the quicklook images and movies available at the top of this page.**
** This zip file also contains image products not displayed on this page: A PNG of Stokes I, Q, U, V images at each wavelength across the emission line [filenames ending in ‘.iquv.all.png’]; a PNG of the average (and median) Stokes I, Q, U, V for each emission line [filenames ending in ‘iquv.png’]; and a PNG of all the level 2 average data products for each emission line [filenames ending in ‘.l2.all.png’].
Additional information provided in EACH ‘tar’ and ‘zip’ file
All tar and zip files contain helpful information for the user that include:
| SPECTRAL LINE | WAVELENGTH [nm] | logTeff |
| FeXIV [corona] 1 | 530.3 | 6.15 to 6.49 |
| FeX [corona] | 637.4 | 5.80 to 6.24 |
| NiXV [corona] 2 | 670.16 | 6.40 |
| ArXI [corona] 3 | 691.8 | 6.04 to 6.52 |
| FeXV [corona] | 706.2 | 6.20 to 6.63 |
| SXII [corona] 2 | 761.10 | 6.34 |
| FeXi [corona] | 789.4 | 5.92 to 6.30 |
| NiXV [corona] 2 | 802.41 | 6.40 |
| SVIII [corona] 2 | 991.26 | 5.90 |
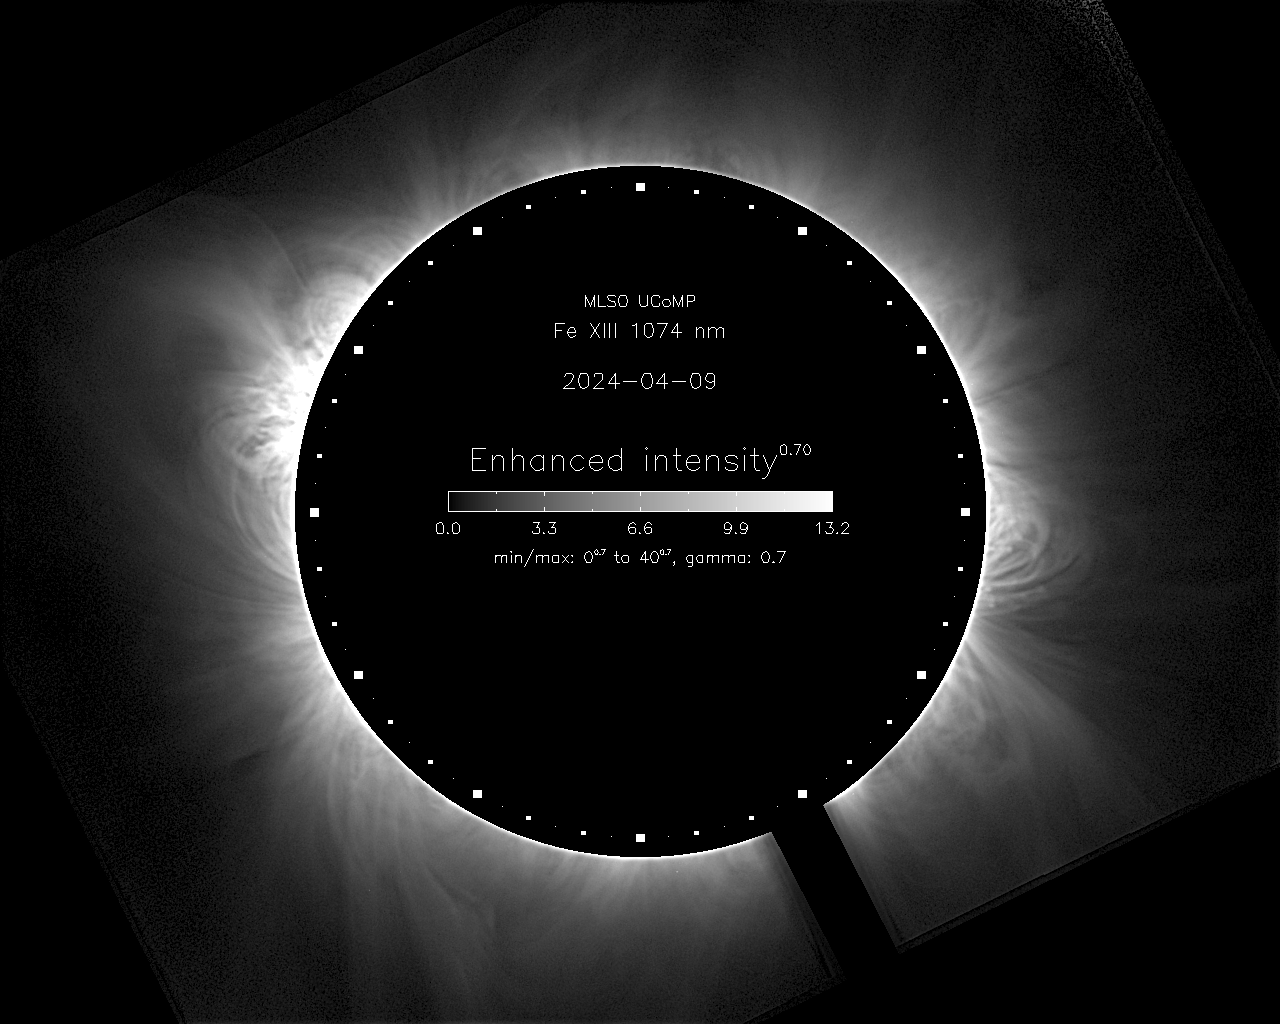
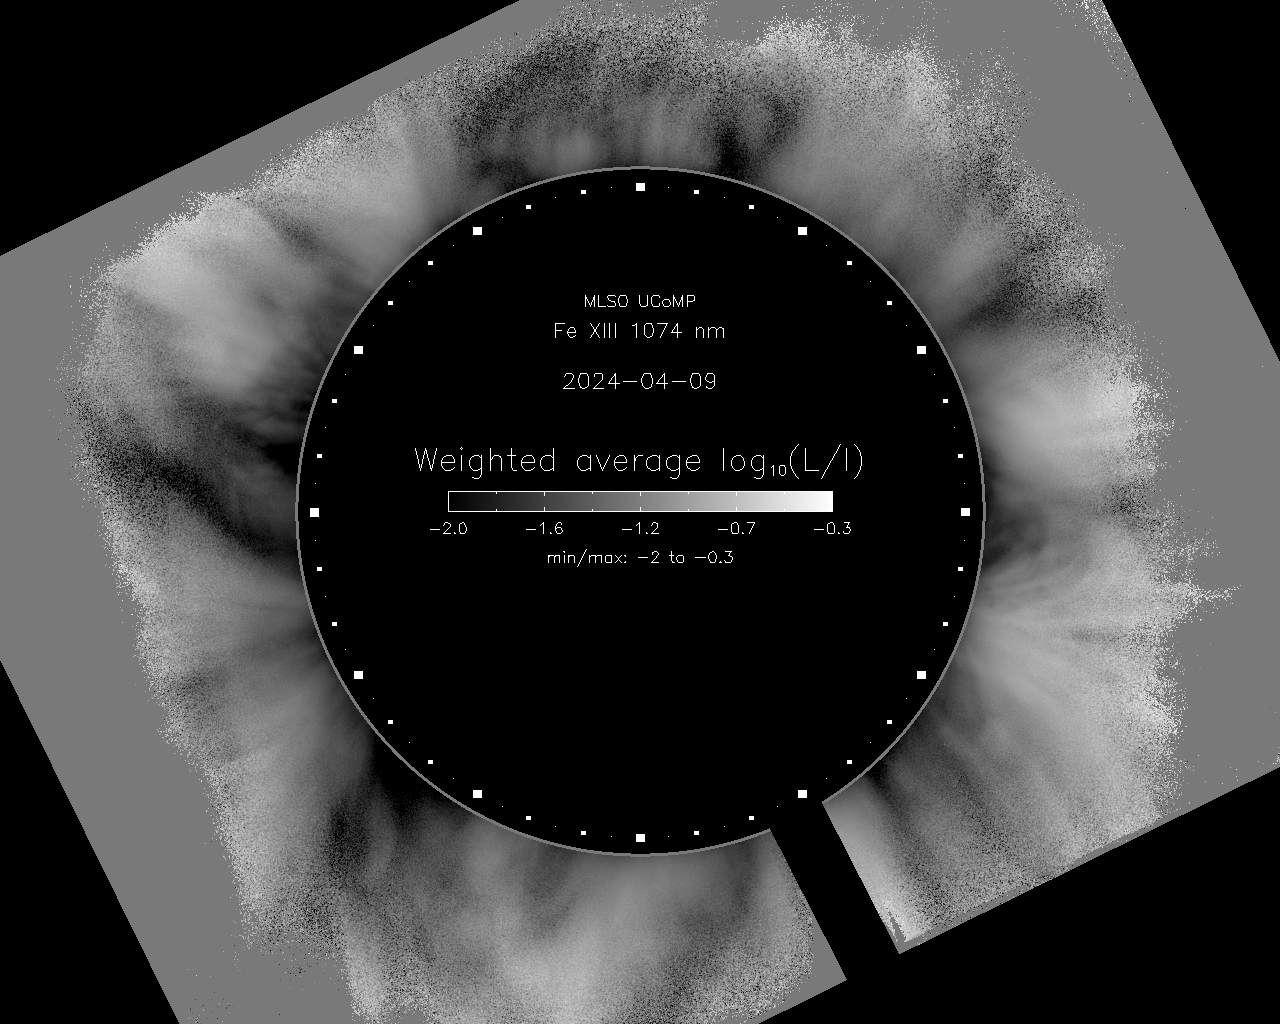
| FeXIII [corona] | 1074.7 | 6.08 to 6.41 |
| FeXIII [corona] | 1079.8 | 6.08 to 6.41 |
| HI [chromosphere] 3 | 656.3 | 4.01 to 4.29 |
| HeI [chromosphere] 3 | 1083 | 4.01 to 4.57 |
