
Past Features
This page lists out the IEM Daily Features for a month at a time. Features have been posted on most days since February 2002. List all feature titles.
Mon Sep 02, 2024

Fall Season Downward Trend
02 Sep 2024 05:30 AM
The featured chart presents the daily high and low temperature climatology for Ames based on two periods of record for the site. A comparison is made between the climatology between 1893 to 1950 and that from 1951 to 2024. The left panel plots the daily averages and the top right panel plots the difference for high and low temperatures between these two periods. The bottom right panel shows the difference in the average monthly values. The overall item of interest for this time of year is the daily descent shown once the calendar turns September with the modest decline during August quickly accelerating during September!
Voting: Good - 4 Bad - 0
Generate This Chart on Website
Tue Sep 03, 2024

Leaky Bucket Model
03 Sep 2024 05:30 AM
The Leaky Bucket concept/model has many applications to many disciplines. The concept can be a simple understanding of some process having inputs, outputs, and a fixed capacity buffering the two. This can be applied to the surface water budget as inputs (precipitation), outputs (runoff, evaporation, infiltration) and capacity (soil water holding capacity) can be generalized. The featured chart presents such a model with fixed parameters of a bucket with depth of one inch and a fixed daily loss rate of 0.15 inches. The implication is that any daily rainfall over 1.15 inches (based on the autoplot's implemented algorithm) will overtop the bucket and be "lost". Or this can be considered runoff that is no longer available for soil infiltration. The top panel shows the bucket depth, which increases due to received rainfall and decreases each day by 0.15 inches. Once the bucket is empty, the water level can not go negative. So it is informative to count up the number of days for the season that the bucket was empty. This is generally a proxy to water availability stress. So for the 1 May to 2 Sep period for Ames, the mean average number of such days is 50 and the 2024 total comes in well below that number. The side panel shows the largest and smallest accumulations and the usual suspects are listed, including just one such day found for 1993 and a number of the Dust Bowl era years within the top 10. You can certainly play with this autoplot tool and select your own bucket depth and loss rates.
Voting: Good - 9 Bad - 0
Tags: bucket
Generate This Chart on Website
Wed Sep 04, 2024

Doing well for 70s
04 Sep 2024 05:30 AM
Tuesday was yet another rather very nice day for temperatures in Iowa with most of the state enjoying highs in the 70s. The featured chart presents an accounting of the number of year to date days with a high temperature in a given partition. This year is shown along with last year and a simple period of record average. The 2024 total of 59 days is about 16 days above average! The totals for values in the 50s and 60s are even above average, thanks to many warm days we had early this spring. Slightly below average values can be found in the 80s and more so in the 90s. The near term forecast looks to continue the very pleasant temperatures with not much chances for rain.
Voting: Good - 14 Bad - 0
Generate This Chart on Website
Thu Sep 05, 2024

Green, for now
05 Sep 2024 05:30 AM
With clear skies on Wednesday, it is a good time to check on what we look like from space. The featured imagery is courtesy of NASA Worldview and shows a true color imagery from the Terra MODIS satellite. Much of the state is a lush green yet, but some browns are starting to appear as corn begins senescence. It won't be much longer until soybeans start to turn as well and the state will look much different from space.
Voting: Good - 13 Bad - 0
Tags: modis
Fri Sep 06, 2024

Big Game Weather
06 Sep 2024 05:30 AM
The big college football game is this weekend as Iowa State takes on Iowa in Iowa City on Saturday afternoon. The current forecast looks amazing for football with temperatures in the 60s and not much wind. The featured chart presents an estimated accounting of game time temperatures and wind speeds based on the nearby airport weather stations at the approximate time of kickoff. The bars are color coded by the game winner. There was no game in 2020 due to the pandemic. Of course, the chart does not show much for a relationship between these two weather metrics and the game winner. Go Cyclones!
Voting: Good - 14 Bad - 2
Tags: football
Mon Sep 09, 2024

Algona vs Iowa
09 Sep 2024 05:30 AM
Of the long term climate stations that the IEM tracks, Algona (north central Iowa) has received the largest amount of precipitation within the state. The featured chart compares the yearly total for the site against an areal averaged value for the state computed by the IEM. As it currently stands, this year's difference is the largest positive difference for the site. A majority of the years see the site's precipitation total below the statewide average, which makes sense as precipitation totals generally decrease as you travel north and west in the state. Unfortunately, this week looks bone dry for all of the state, so this shown difference won't be changing anytime soon!
Voting: Good - 6 Bad - 0
Generate This Chart on Website
Tue Sep 10, 2024

Dry September Stretch
10 Sep 2024 05:30 AM
September has started off very dry with not much to speak of for rainfall over most of the contiguous United States. The featured map presents the current number of consecutive days with or without measurable precipitation. A positive red number indicates a dry streak and negative blue number represents a wet streak. Only two wet streaks are plotted on the map covering the Midwest. There is a chance of light precipitation arriving for the weekend, but it does not appear to amount to much.
Voting: Good - 12 Bad - 0
Generate This Chart on Website
Thu Sep 12, 2024

PRISM Departures
12 Sep 2024 05:30 AM
Going to the 2024 growing season, the lingering drought from the past two seasons was of top concern. A wet spring and early summer erased all of the analyzed drought, at least according to the US Drought Monitor, for Iowa. A dry August and very dry start to September has brought drought concerns back. The featured map presents computed precipitation percentage of average over the period from 1 August till 10 September, according to Oregon State's PRISM Project. Only a few isolated pockets of the state are shown above average for this period with much of the state in the 25 to 50% of average range. The renewed drought will likely not have much impact on the nearly mature corn and soybean crops, but rain now will begin to replenish soil water for next year's growing season.
Voting: Good - 8 Bad - 0
Generate This Chart on Website
Fri Sep 13, 2024

High Temp Streaks of 80+
13 Sep 2024 05:30 AM
A somewhat chilly start to September has given way to rather warm weather for this time of year with Thursday being the fourth consecutive day with a high temperature of at least 80 degrees for a number of locations in Iowa. One of those locations is Des Moines and the featured chart presents the maximum such streak by day of the year. The longest streaks overall are listed to the side. Certainly these streaks are the most difficult to maintain during September with the longest such streaks rapidly falling off as the month progresses. At the moment, at least the next seven days are all forecast to be as warm for Des Moines. We'd need to keep the streak going into the last week of this month before getting close to establishing a new such record for this late into the season.
Voting: Good - 16 Bad - 0
Generate This Chart on Website
Mon Sep 16, 2024

ENSO + September
16 Sep 2024 05:30 AM
The very dry and warm September is forecast to continue this week. One may wonder if the current El Nino state is to blame for this weather, so that is the focus of today's daily feature. The featured plot compares statewide September precipitation and average temperatures against the August El Nino index value. The dots on the left hand side plot are colored by the index value and the right two plots directly compare the two. Not much for a relationship is to be found, with perhaps only some subtle trends if you squint your eyes closely enough. In general, the El Nino Southern Oscillation (ENSO) typically has more of an impact during the winter into spring months. The present forecast has a strong chance of a La Nina this winter, so you can play with this autoplot and see if you can generate any interesting relationships yourself!
Voting: Good - 8 Bad - 0
Generate This Chart on Website
Tue Sep 17, 2024

12 Days of 80+
17 Sep 2024 05:30 AM
Monday was yet another very warm September day with high and low temperatures well above average. For Ames, it was the 8th consecutive day with a daily high temperature of at least 80°F. The present forecast has such days continuing through Friday before slightly cooler highs on Saturday. If the forecast for the next four days holds, it would make for a twelve day streak. The featured chart presents the day of year frequency of participating in such a streak with the earliest and latest such streaks listed at the site. This year's streak would fall a number of days short for being the latest on record.
Voting: Good - 8 Bad - 0
Generate This Chart on Website
Wed Sep 18, 2024

September 70+ Hours
18 Sep 2024 05:30 AM
Tuesday was yet another very warm September day with highs in the 80s and even a few isolated 90 degree readings. The featured chart attempts to put into context the warm weather this September by totaling up the number of hours for Des Moines with an air temperature of at least 70°F. The top panel shows the number of hours each year and the bottom panel compares the hour of day totals for this year and a long term simple average. So while the 2024 total is above a long term average, there have been a number of years over the past decade with a higher number of hours than this year. Climatology rapidly decreases in temperature during September, so warm weather should certainly be enjoyed!
Voting: Good - 5 Bad - 0
Generate This Chart on Website
Thu Sep 19, 2024
Watches Touching Iowa
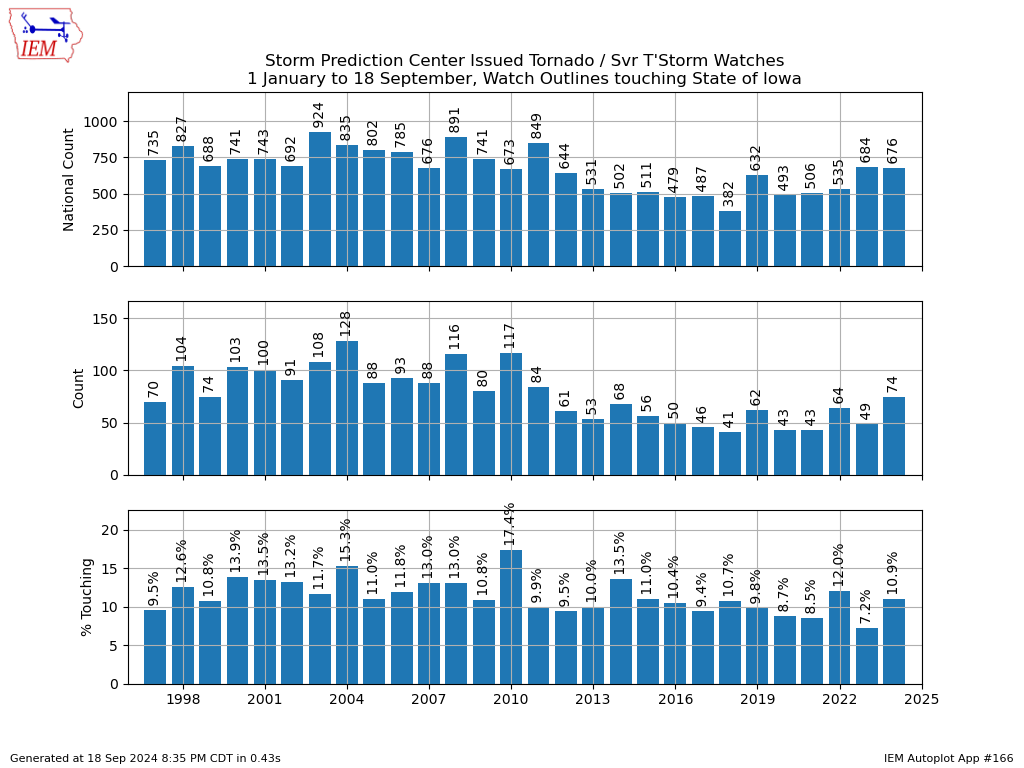
19 Sep 2024 05:30 AM
The Storm Prediction Center (SPC) has a slight risk of severe storms over Iowa today as it finally appears that organized precipitation will happen this month! It would seem that a severe thunderstorm or tornado watch will be possible for portions of northern Iowa sometime this afternoon, so it is a good time to check in on a watch issuance metric! The featured chart presents the number of SPC issued watches for the year to date period, those whose watch polygon box overlap Iowa, and the percentage between the two. It is interesting to see how the 2024 total for Iowa is the highest since 2011, but almost every year prior to 2011 was higher than 2024. A caveat is that watch methodologies have changed somewhat over the years and this plot is using the unofficial, but still a close approximation, polygons instead of counties. It is still interesting to see that roughly 10% of all watches touch the state in some manner.
Voting: Good - 8 Bad - 0
Tags: spc watch
Generate This Chart on Website