Principles of Economics/Wage
Firm's isoprofit line
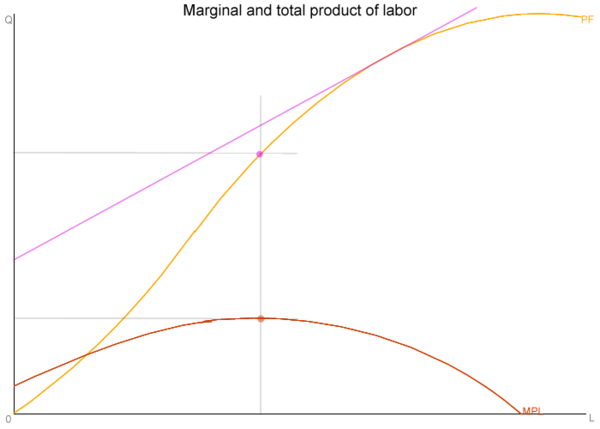
[edit | edit source]This purple isoprofit line is more realistic of a firm, for it intersects the production frontier somewhere to the right of the maximum marginal product of labor. The y intercept is the profit to the firm after subtracting costs of hiring labor. However, this amount does not translate to economic profit; in perfect competition the default height of the y intercept (the intermediate profit) is equal to the fixed cost of the firm, with the result that there is no economic profit.
Labor hired
[edit | edit source]The point where the highest isoprofit line overlaps with the production frontier is where the firm will produce. Any higher isoprofit line is unattainable and any lower isoprofit line will generate less than optimal profits. The result is that more workers are hired than the one that helps increase profit the most (has the highest marginal product of labor, MPL). The slope of the isoprofit line determines where this position actually is. The right brown point is the position of the firm's labor hired.
Wage rate
[edit | edit source]In perfect competition, firms can only afford to hire workers at the same amount of profit they can generate for the firm. Extending the right brown point (position at which hiring stops) gives the wage rate. Supposedly, all firms in the industry are equally productive and thus reach this same point, which brings about labor equilibrium. First, we must multiply the graph, which is in terms of units production in the y axis, to currency (P). This changes the marginal product of labor MPL into marginal revenue product MRP (or marginal revenue of labor MRL). The MRL definition is clearest because in perfect competition it makes clear sense for a firm to hire workers - marginal cost of labor - at the same amount as the marginal revenue of labor.
Wage loss and surplus
[edit | edit source]A firm's loss and profit can also be shown through the MPL. Since MRP reflects earnings and the wage rate W* reflects expenses, the firm's surplus is the green area in the graph - the area under the MRP but above W*. The firm's losses is the red area in the graph - the area under W* but above MRP. Since the firm stops hiring at the far right corner of the surplus area, there is no additional loss pass that point. In perfect competition the two areas (loss and surplus) cancel each other out, but with the green area exactly fixed cost larger than the red area.


